You are currently browsing offline. Some images may be missing and some functionality may be unavailable.
Tweetstats
Tweetstats
Twitter stats and analytics platform
Laravel, Twitter API
Tweetstats is a platform for viewing charts and stats based on your Twitter usage.
After importing your tweet archive, additional data is imported from Twitter's API to build charts representing your tweet activity, engagements, and interactions.
Unfortunately, following Elon Musk's takeover of Twitter and the ensuing removal of API access, this project is dead. A static version can be viewed below.
This project was built with...
-
Laravel
PHP web application framework
-
Vue.js
Progressive JavaScript framework
-
Tailwind CSS
Utility-first CSS framework
-
Twitter API
Twitter v2 REST API
I started building the first version of Tweetstats in 2013, as I've always had a particular love of charts and visualising data and trends, and Twitter's data entities and relationships made it perfect for creating an analytics dashboard. I built out various charts for your tweets and tweeting habits, as well as a dashboard to view relationships between other users.
I eventually parked the project due to limitations in Twitter's API - I wanted to be able to pull in additional data such as mentions to you and who had liked your tweets, but the API didn't expose the required data. However, I decided to revisit the project when Twitter's new v2 API entered early access, with additional data available and more API endpoints coming in future.
So, with a rebuilt codebase and fresh design, this is the new version of Tweetstats.
The platform focusses on your own tweets and activity, showing tweet trends over time, and when you tweet most often. Engagements with your tweets are visualised, giving insights on retweets and likes your tweets have received. You can see how you interact with other users on Twitter, with your top users for replying, retweeting, quoting, and liking, as well as your most popular tweets. The additional relationship view shows you how you have interacted with another user, including replies, retweets, and likes between the two of you.
As it is primarily based on your own tweet activity, Tweetstats is not intended for marketers or advanced analytics - instead, it is simply aimed at anyone who has an interest in data visualisation. It is free to use - all you need to do to use it is download your Tweet archive from twitter.com and import some files from it.
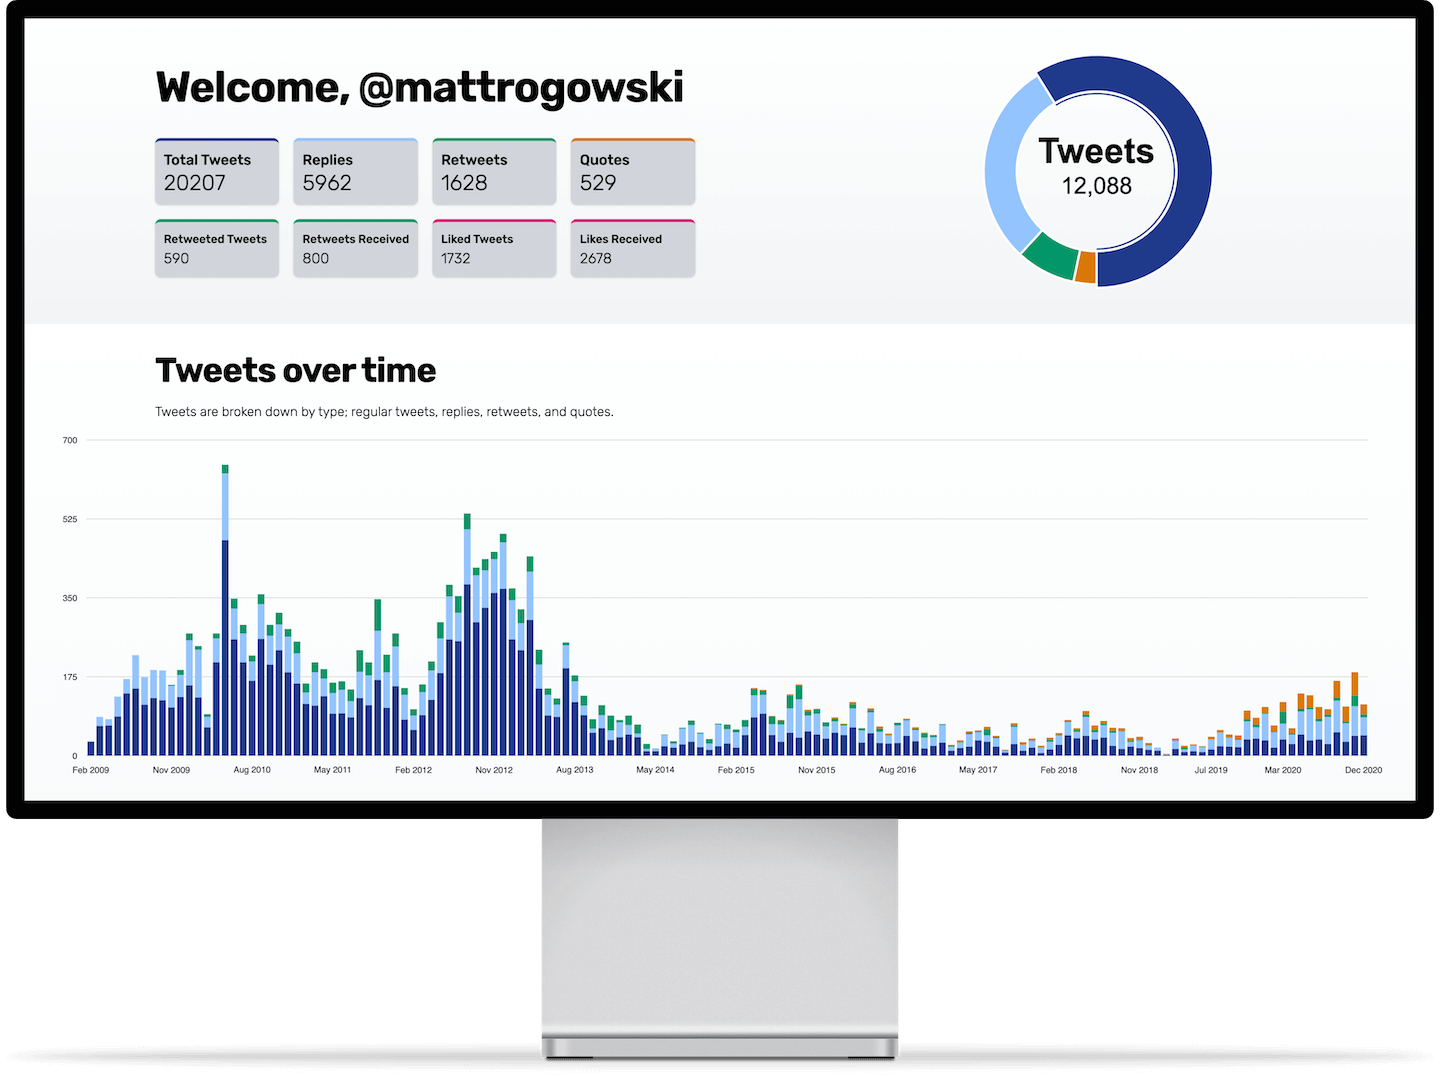
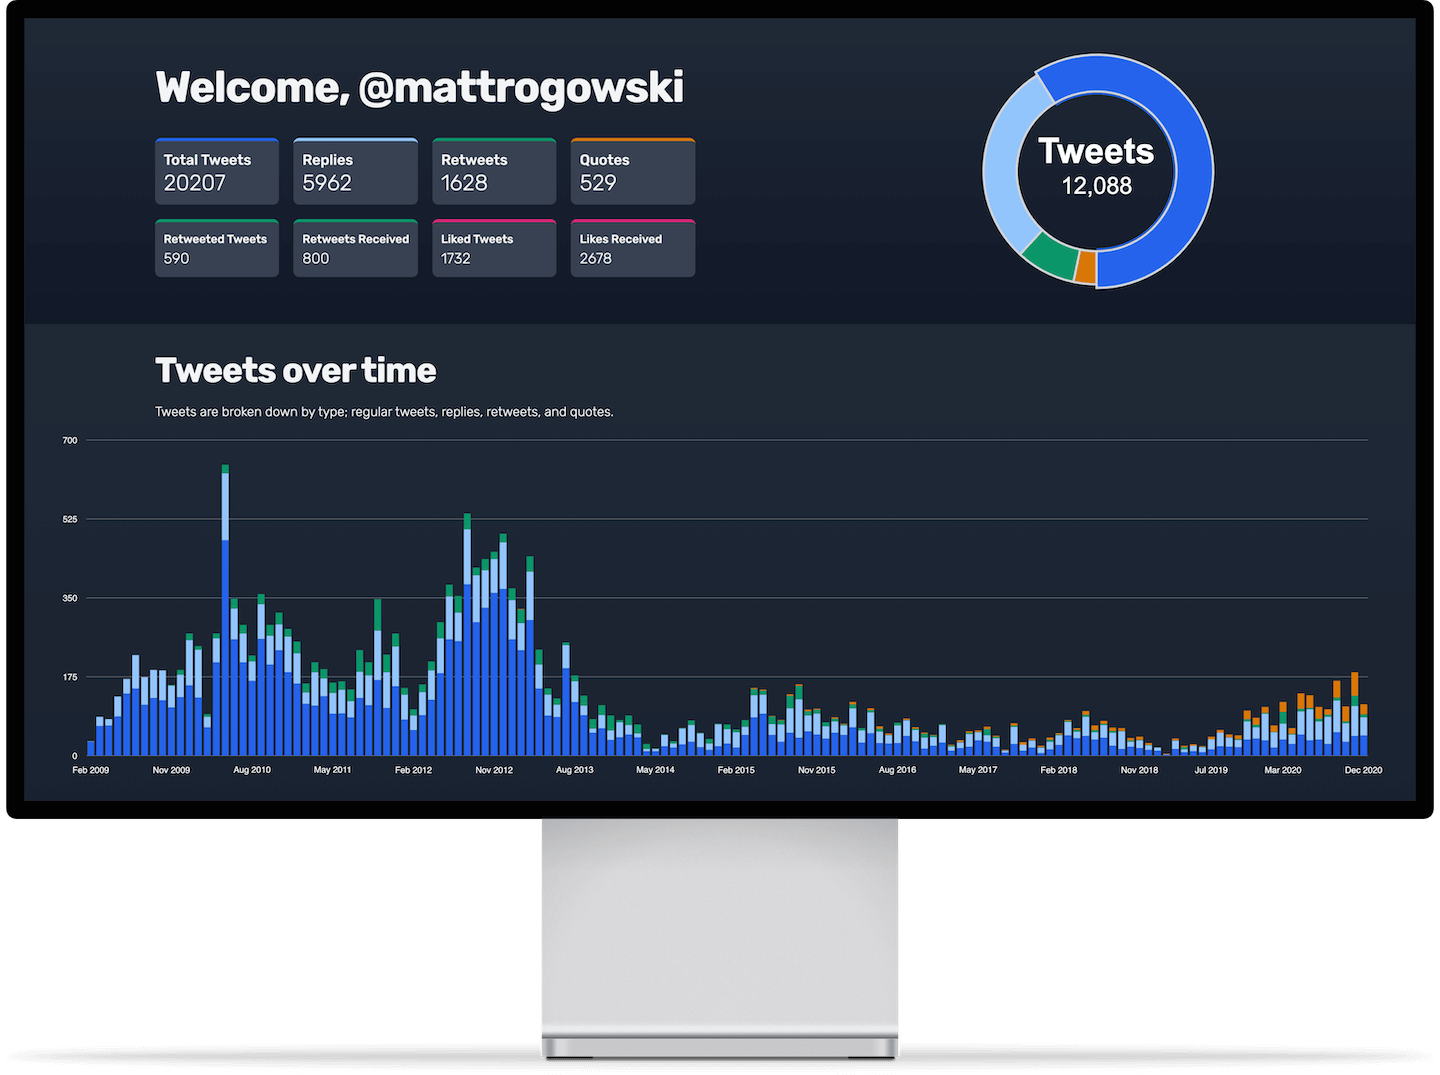
User Stats Dashboard
Tweet Types and Trends
The primary stats are an overview of how many of each type of tweet you have posted, as well as how many tweets you have had retweeted and liked, and how many retweets and likes they have received.
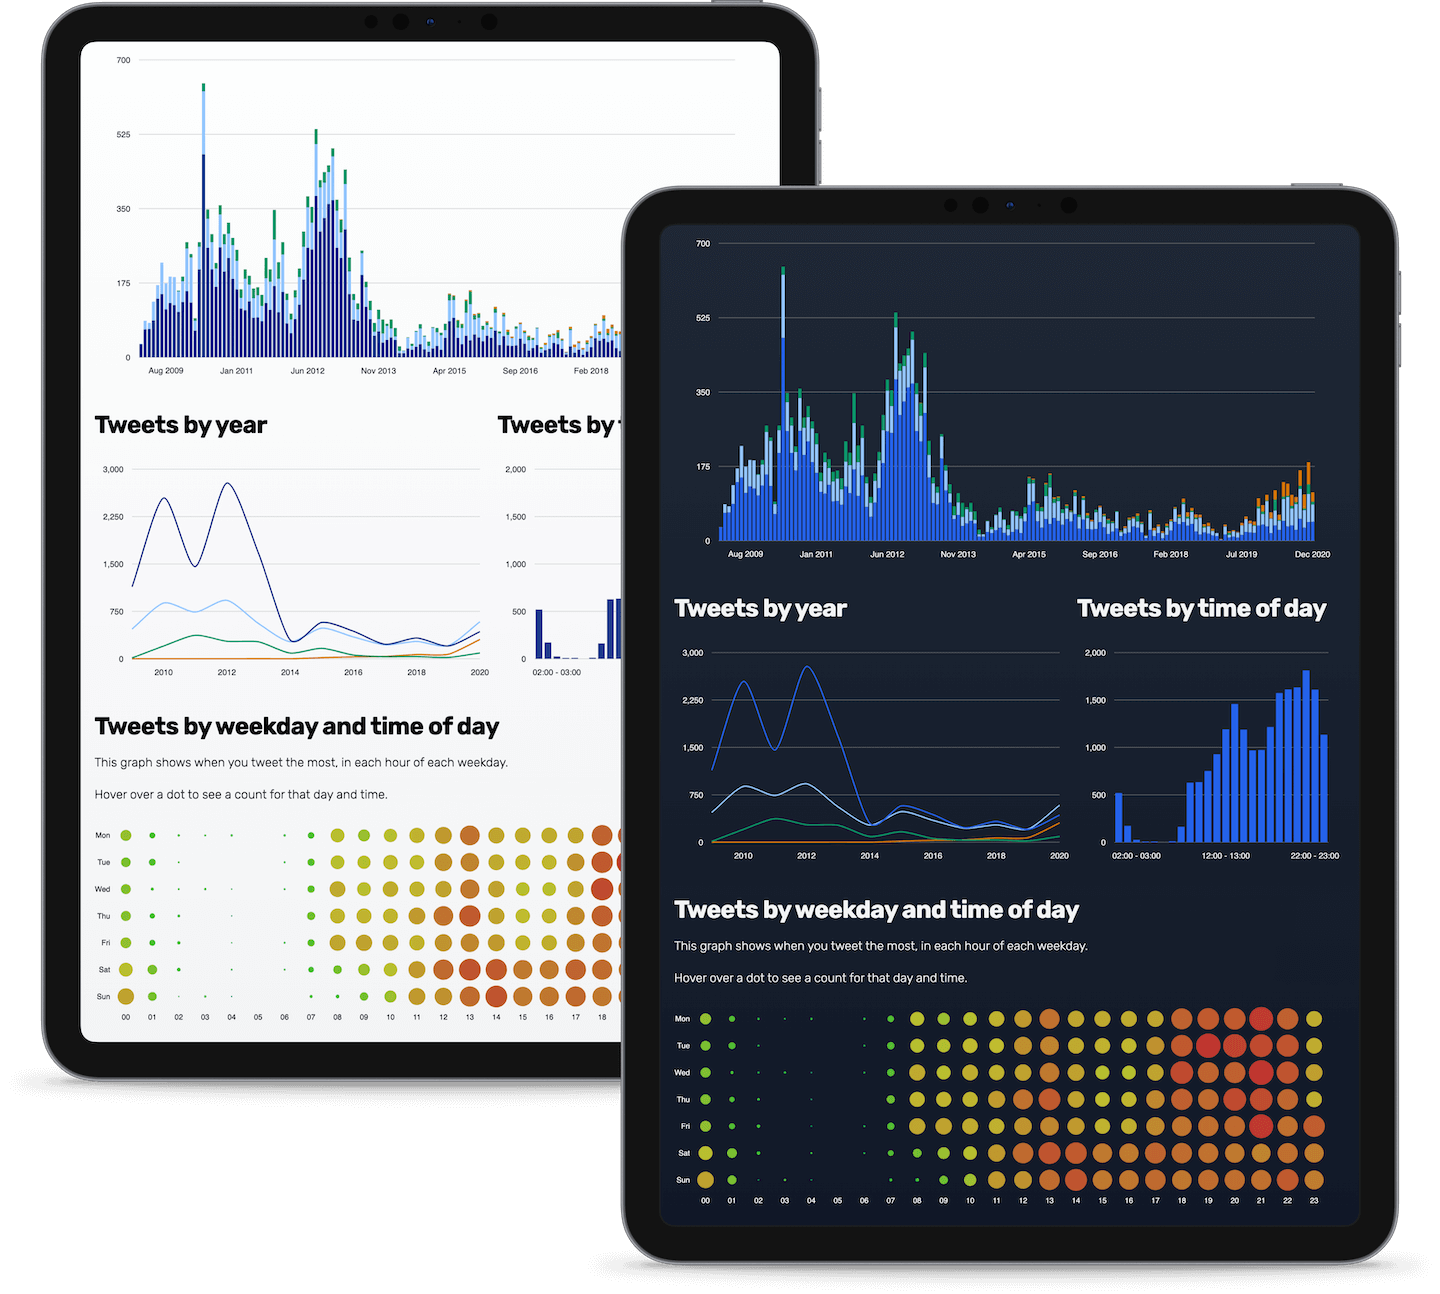
Tweet types are then displayed on a monthly basis, broken down by type (normal tweets, replies, retweets, and quotes).
Further charts are available to show trends, such as yearly tweet counts and what time of day you tweet at, including a heatmap for time of day and weekday.
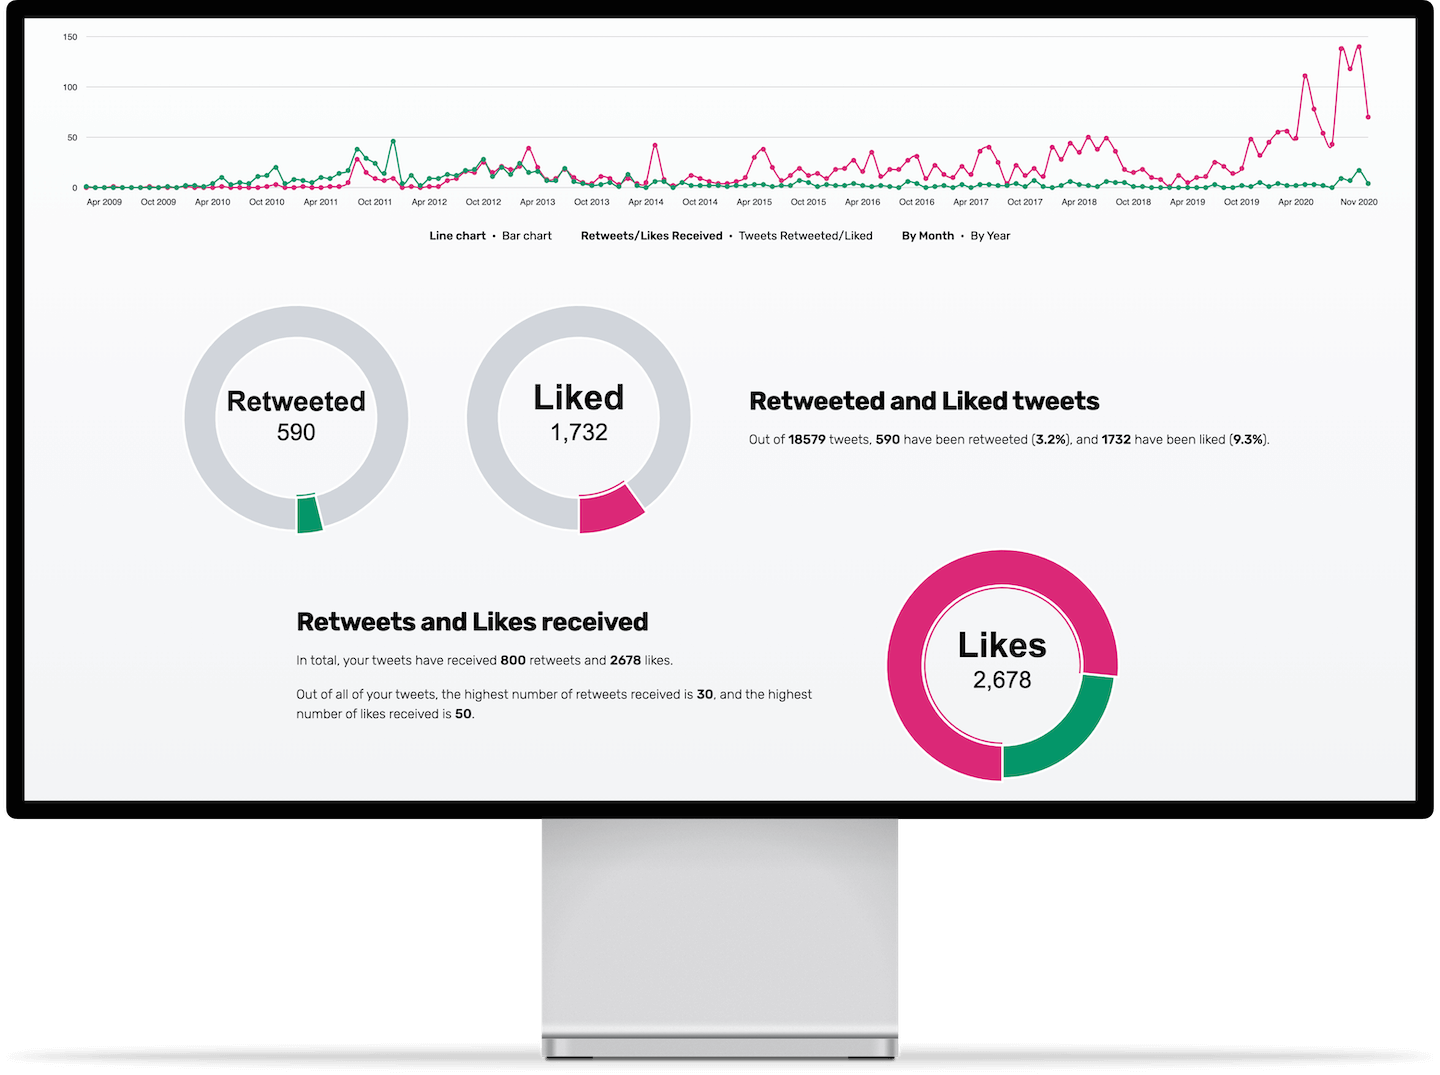
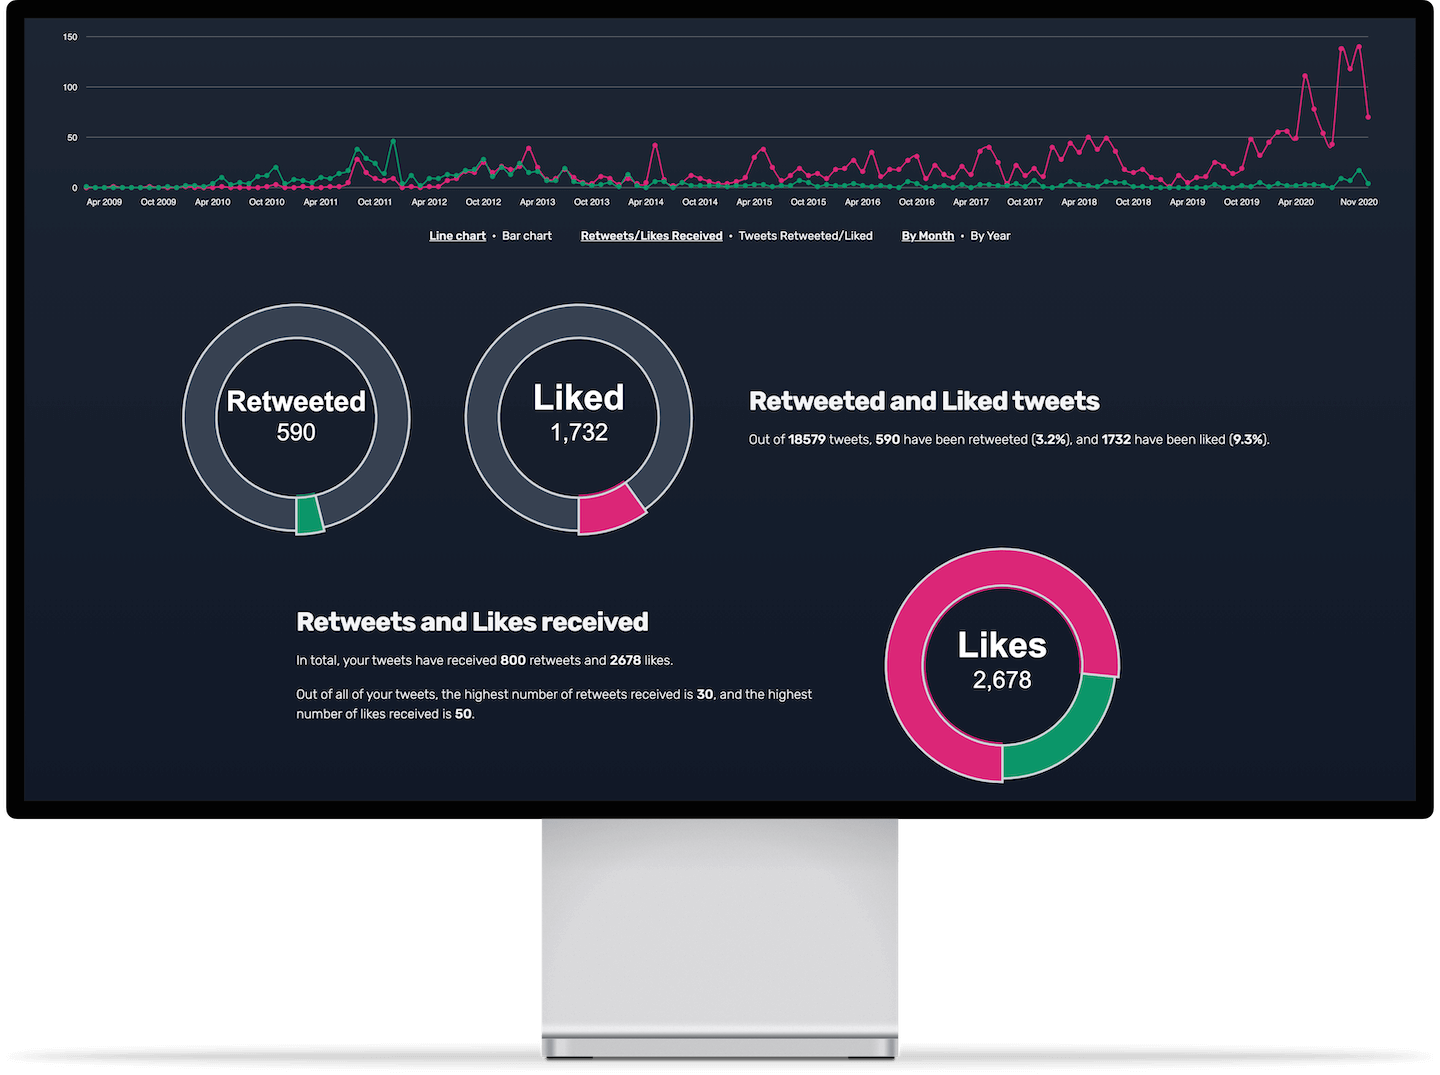
User Stats Dashboard
Engagements (Retweets and Likes)
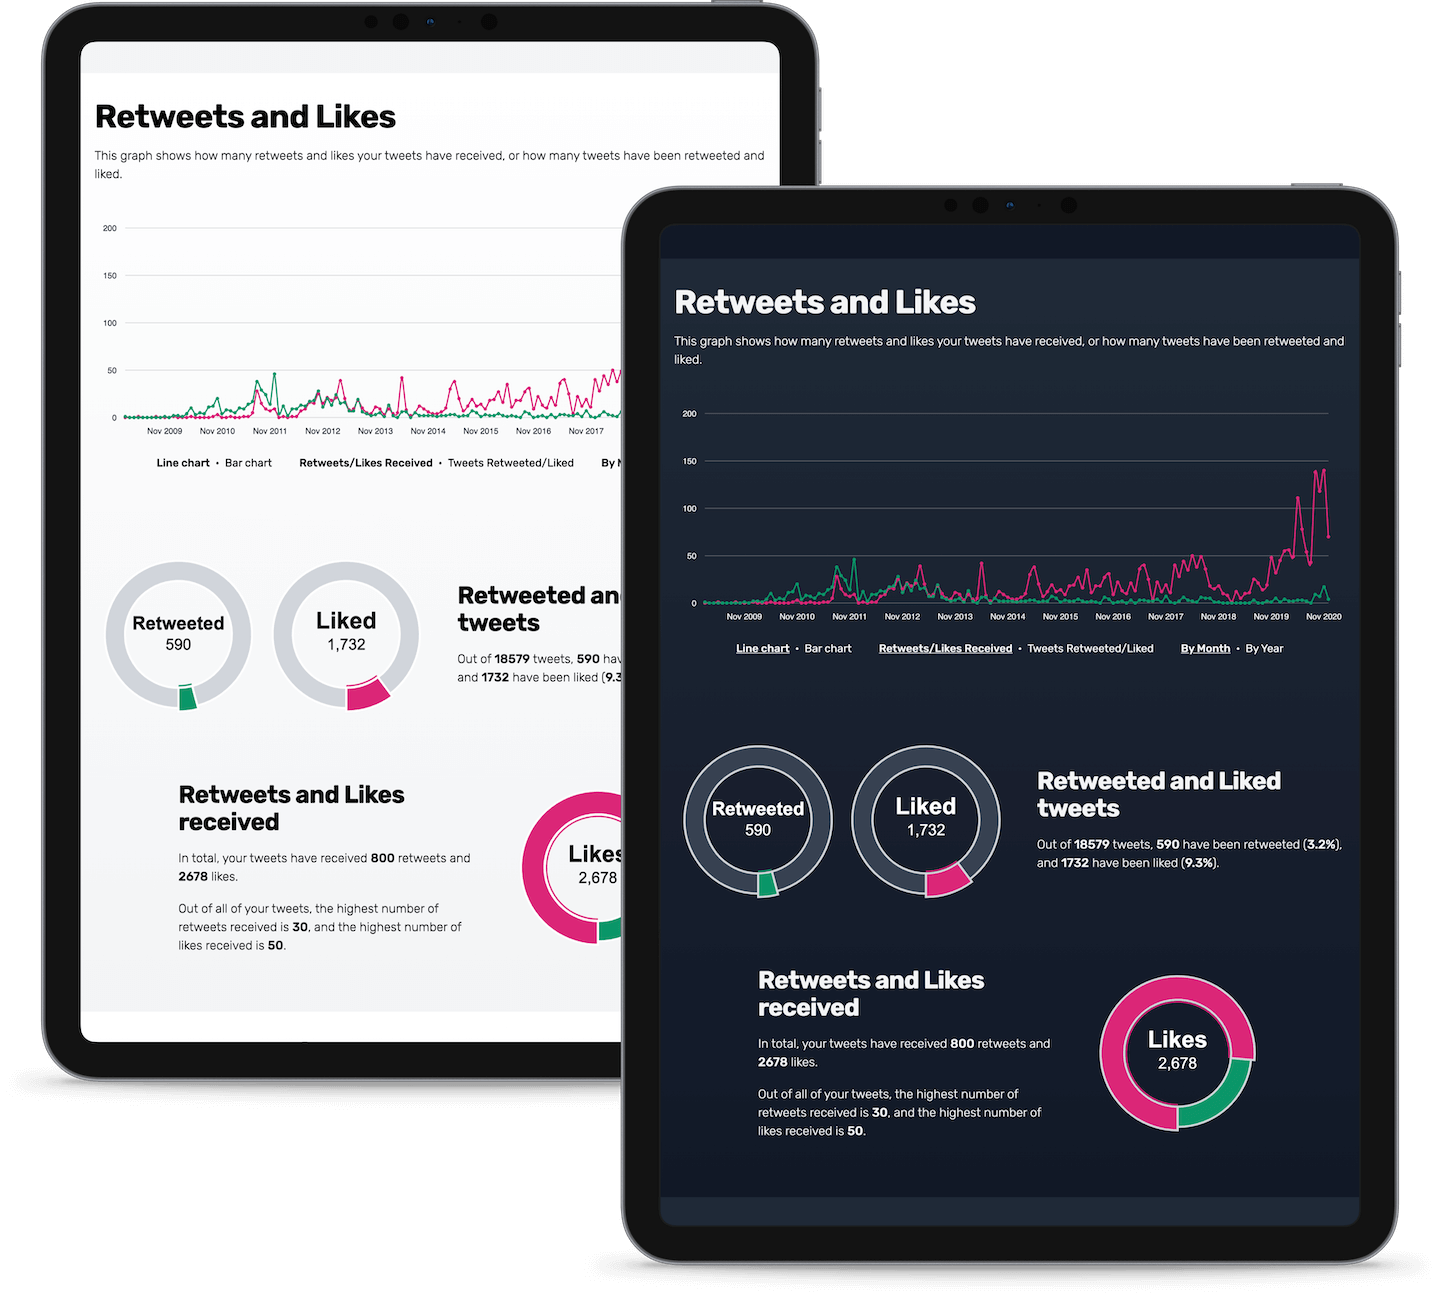
One key metric for how popular your tweets are is how many retweets and likes they receive.
The main chart shows counts for retweets and likes recieved, with the option to display how many tweets have been retweeted and liked.
Additional charts shows the proportion of tweets that have been retweeted and liked, and a comparison of retweets and likes received.
User Stats Dashboard
Interactions
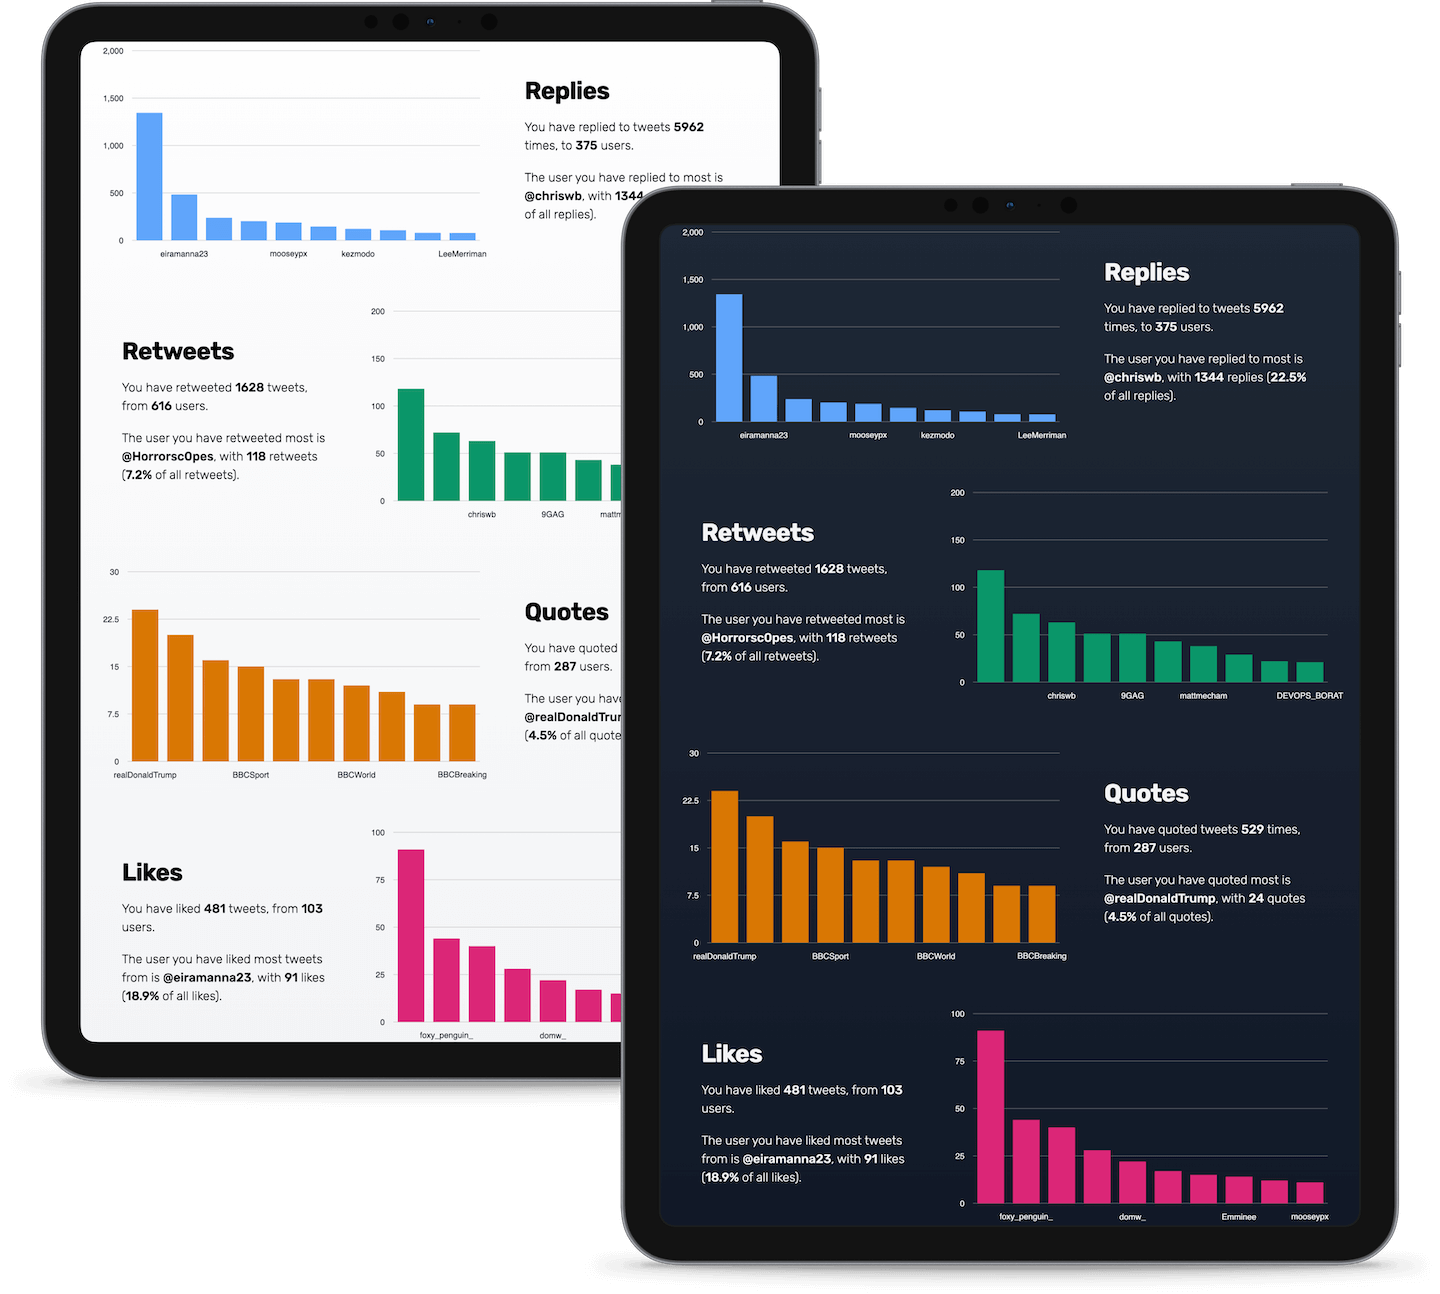
When using Twitter you will frequently interact with other users.
These charts show the accounts you most frequently, reply to, retweet, quote, and like tweets by, as well as details on the number of tweets for the users you interacted with the most.
User Stats Dashboard
Top Tweets
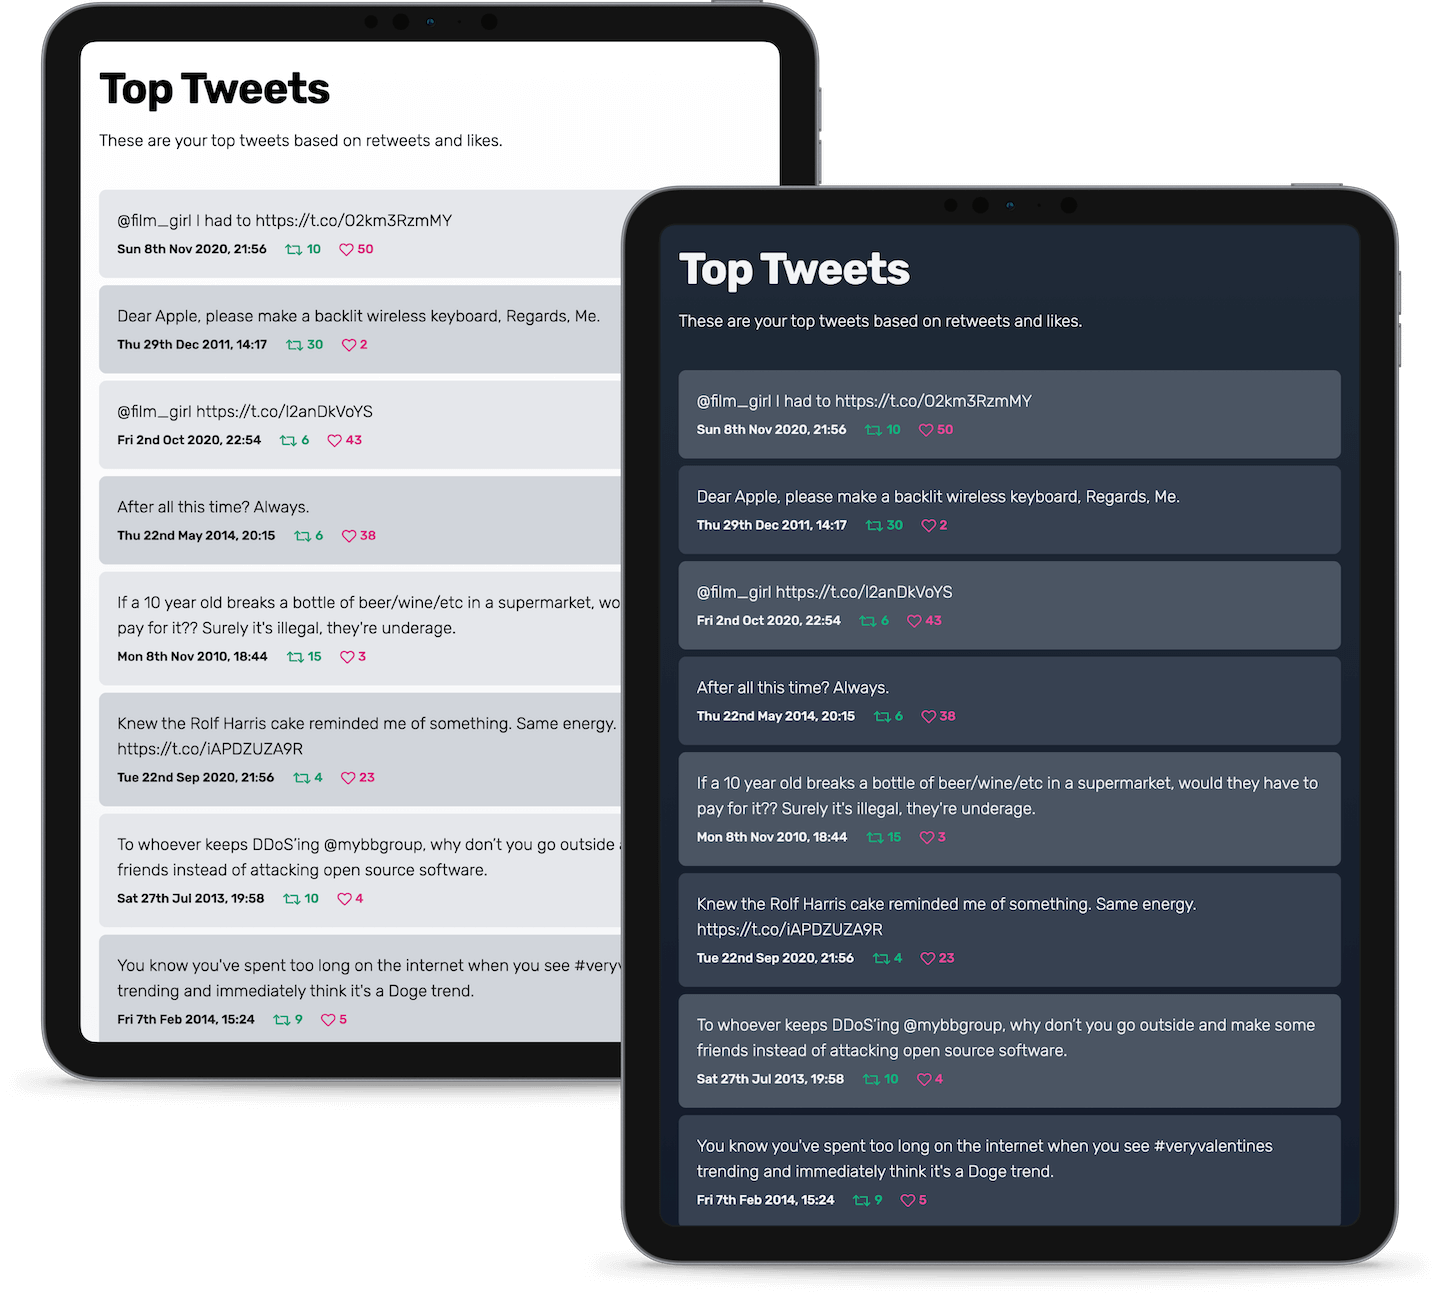
Not everyone has tweets go viral, but sometimes you'll have a tweet that does quite well.
This list displays your top tweets based on the number of retweets and likes they have received.
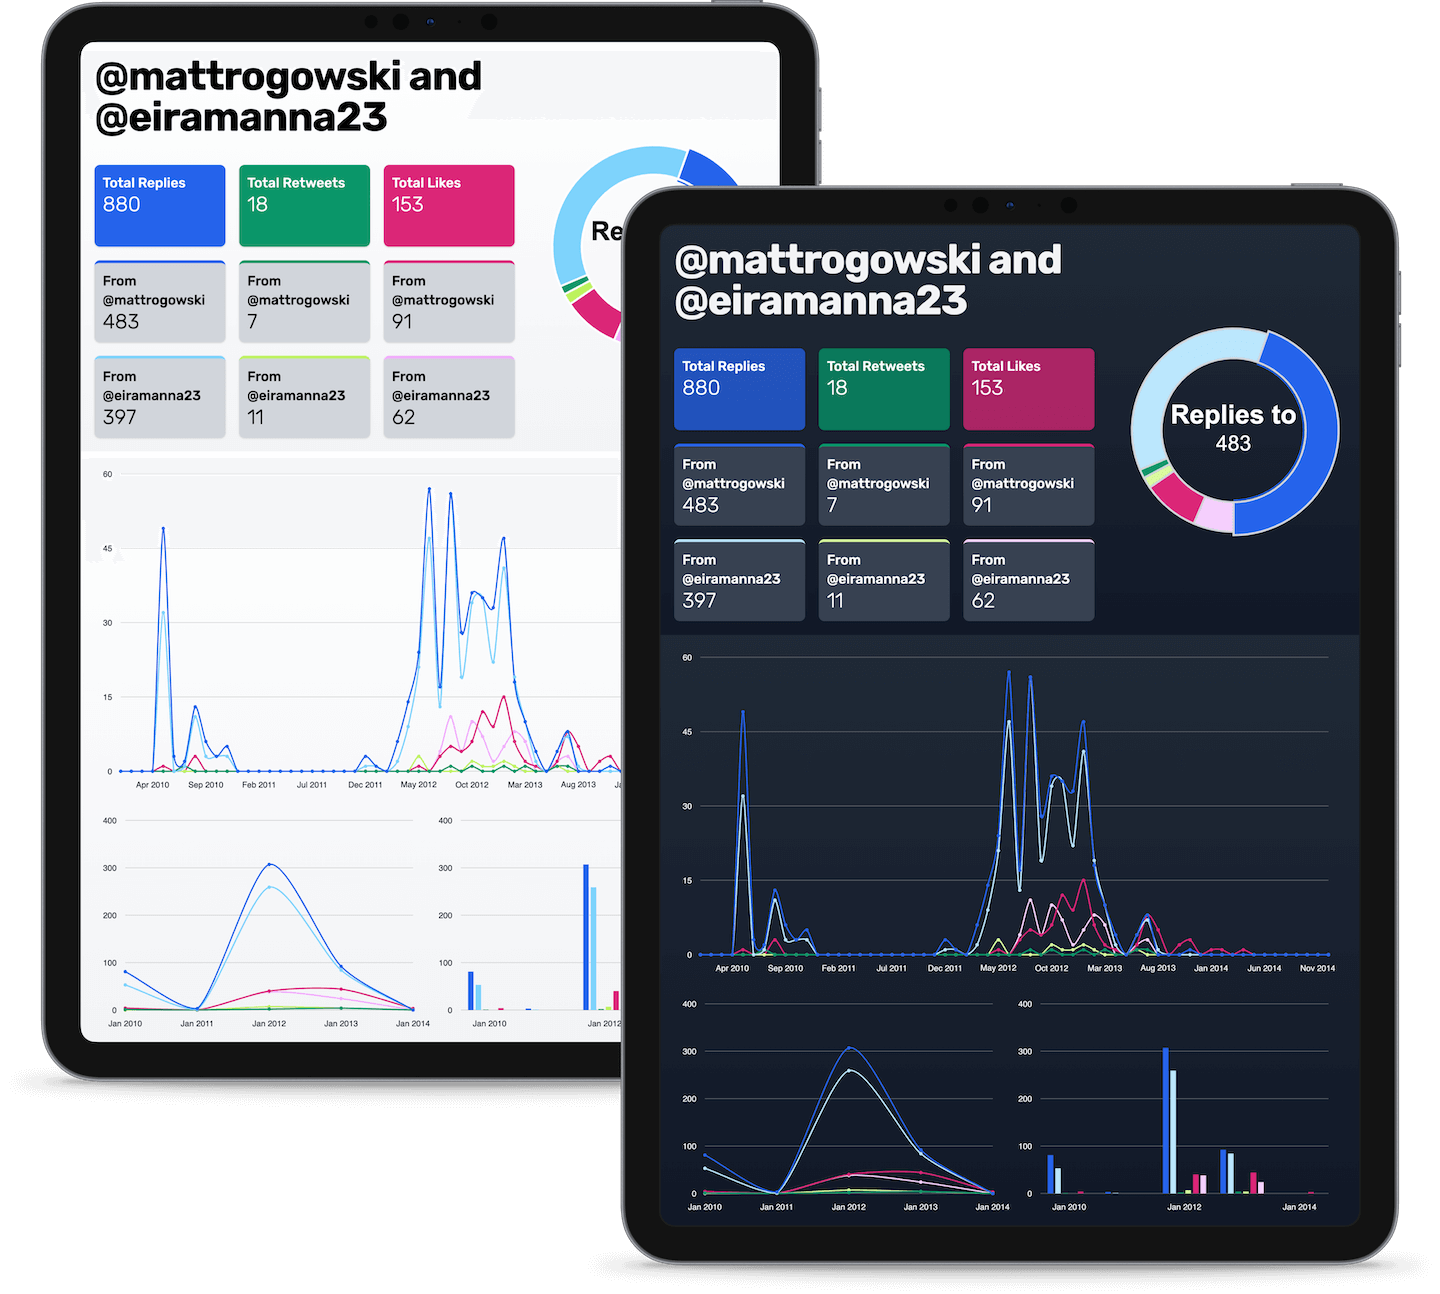
Relationship Stats Dashboard
Tweet Types
The primary stats are an overview of how many times you have interacted with another user, with counts of replies, retweets, and likes between you.
Further charts are available to show trends of how you interacted with the user over time.
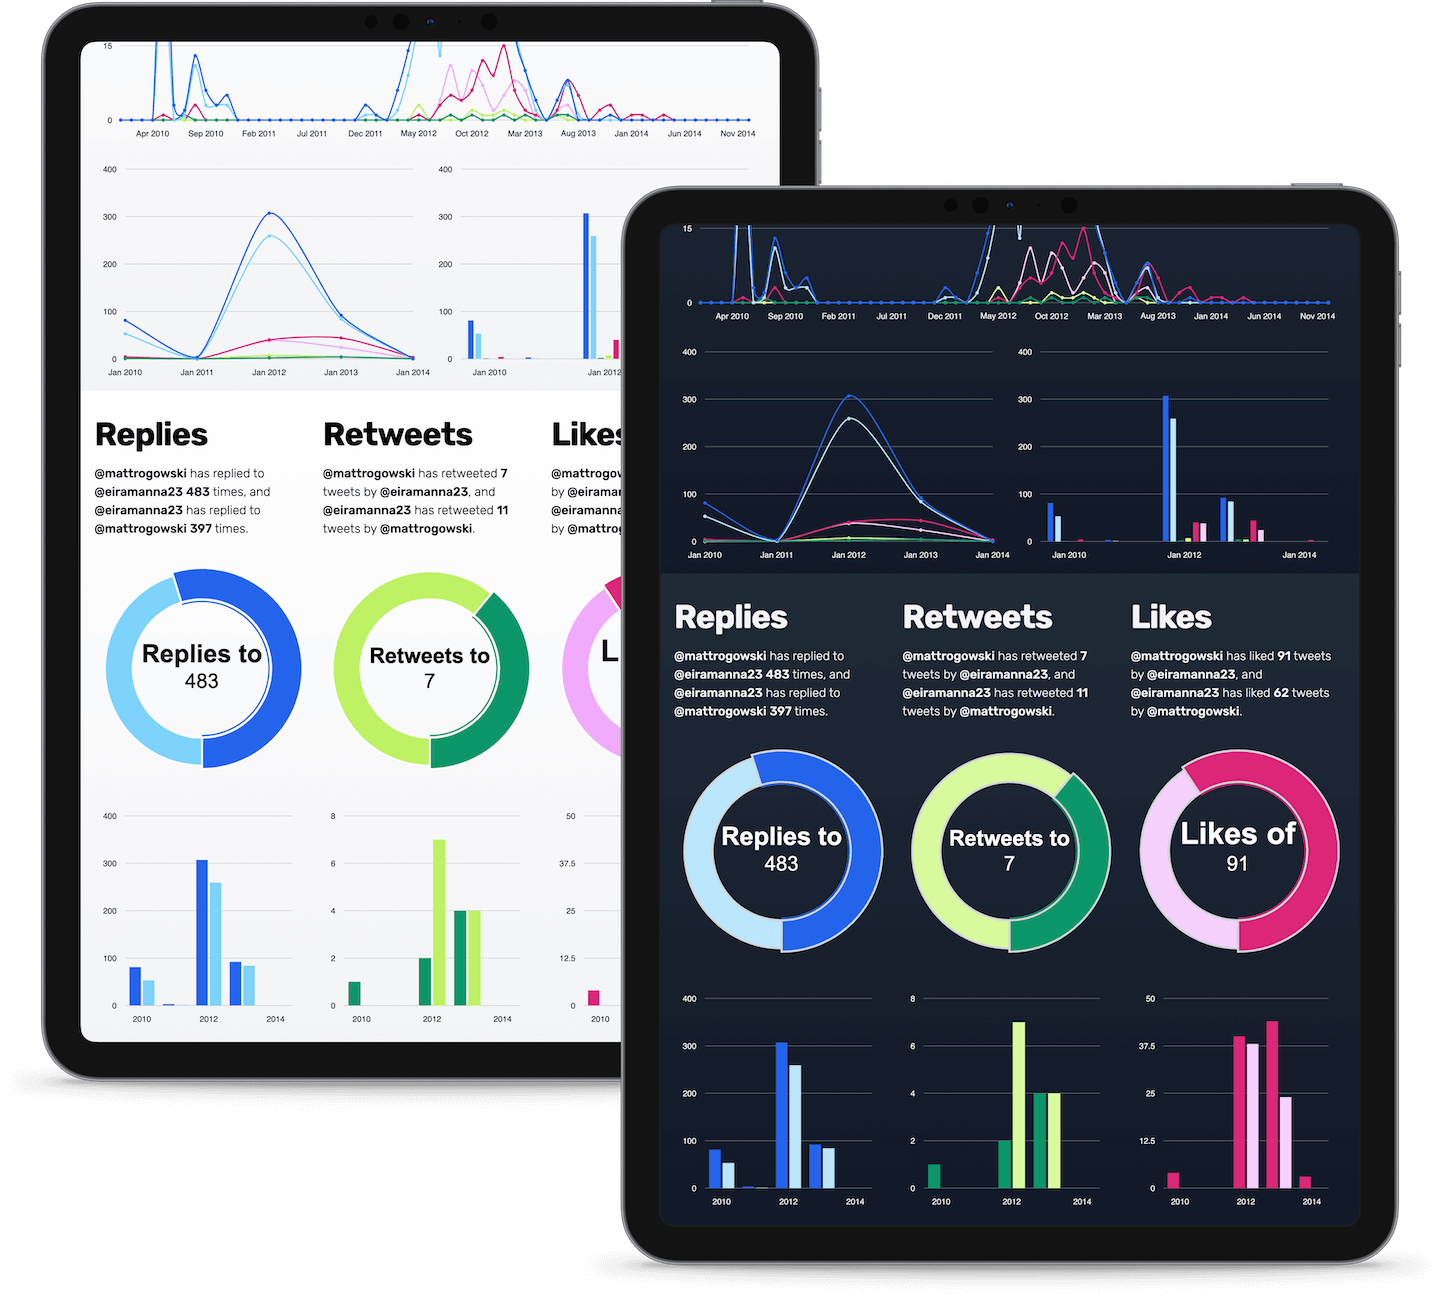
Relationship Stats Dashboard
Interactions
Here you can see a breakdown of each interaction type, with stats on how many times you have replied to, retweeted, and liked tweets from the user, and how many times they interacted with you.
You can see counts as a proportion of all interactions, and how you interacted with the user over time.
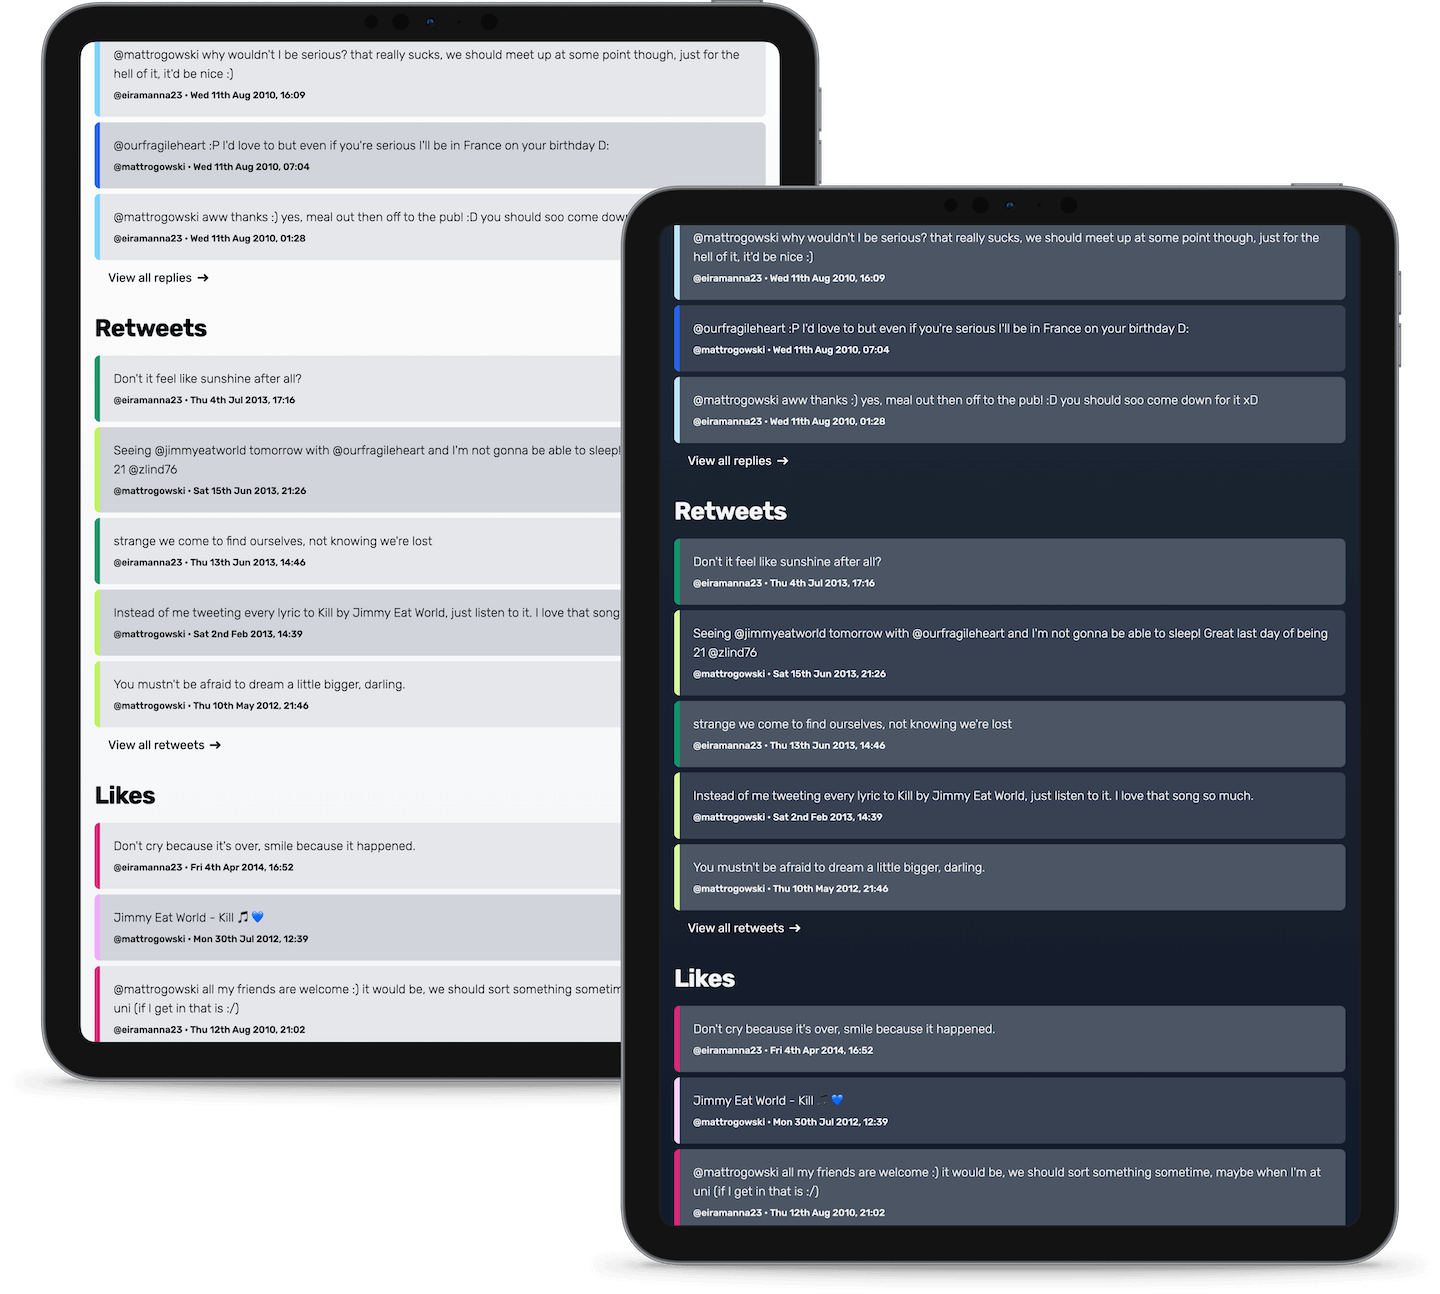
Relationship Stats Dashboard
Tweets
Here you can see all the tweets that make up the interactions between you and the other user, with the 5 most recent replies, retweets, and likes, with links through to a full list.
Interested in working together?

Some other projects...
Eastern Blues
Chelsea supporter's group website and bespoke member area
Statamic, Laravel, Stripe
I built Eastern Blues' new website with Statamic featuring event booking, and their bespoke member area with Laravel, featuring match ticket booking, galleries, and much more.
James McKenzie Wills
Will writing company website and payment portal
Statamic, Laravel, Stripe
I built James McKenzie's new website with Statamic, and a bespoke payment portal for their customers to purchase their services through.